Total Cost of Ownership in Public Sector Software Deals
Sloppy vendor selection creates cascading costs that consume 79 percent of federal IT budgets.
The Scale of Public Sector IT Spending That Makes TCO Miscalculation Consequential
The numbers are large enough that even a fractional miscalculation becomes a policy crisis. U.S. federal IT investment reached $102.31 billion in FY2025. State and local government IT spending is projected to exceed $153.6 billion that same year. Forrester projects all levels of government will spend $357 billion on technology in 2026. At that aggregate scale, the spread between a well-modeled contract and a carelessly modeled one is not a rounding error. It is a program.
The most telling indicator of what TCO miscalculation produces, accumulated over time, is the federal operations and maintenance ratio. About $83 billion, nearly 79 percent of planned federal IT spending for FY2025, was earmarked for keeping existing systems running. People sometimes frame that as a budget priority. It is a consequence, accumulated dollar by dollar from procurement decisions made years earlier by people who were comparing vendors on license price. Agencies locked into sustaining those decisions have almost nothing left for new capability, and every CIO in that position knows exactly how it happened.
What TCO Actually Measures and How Its Categories Map to a Software Contract
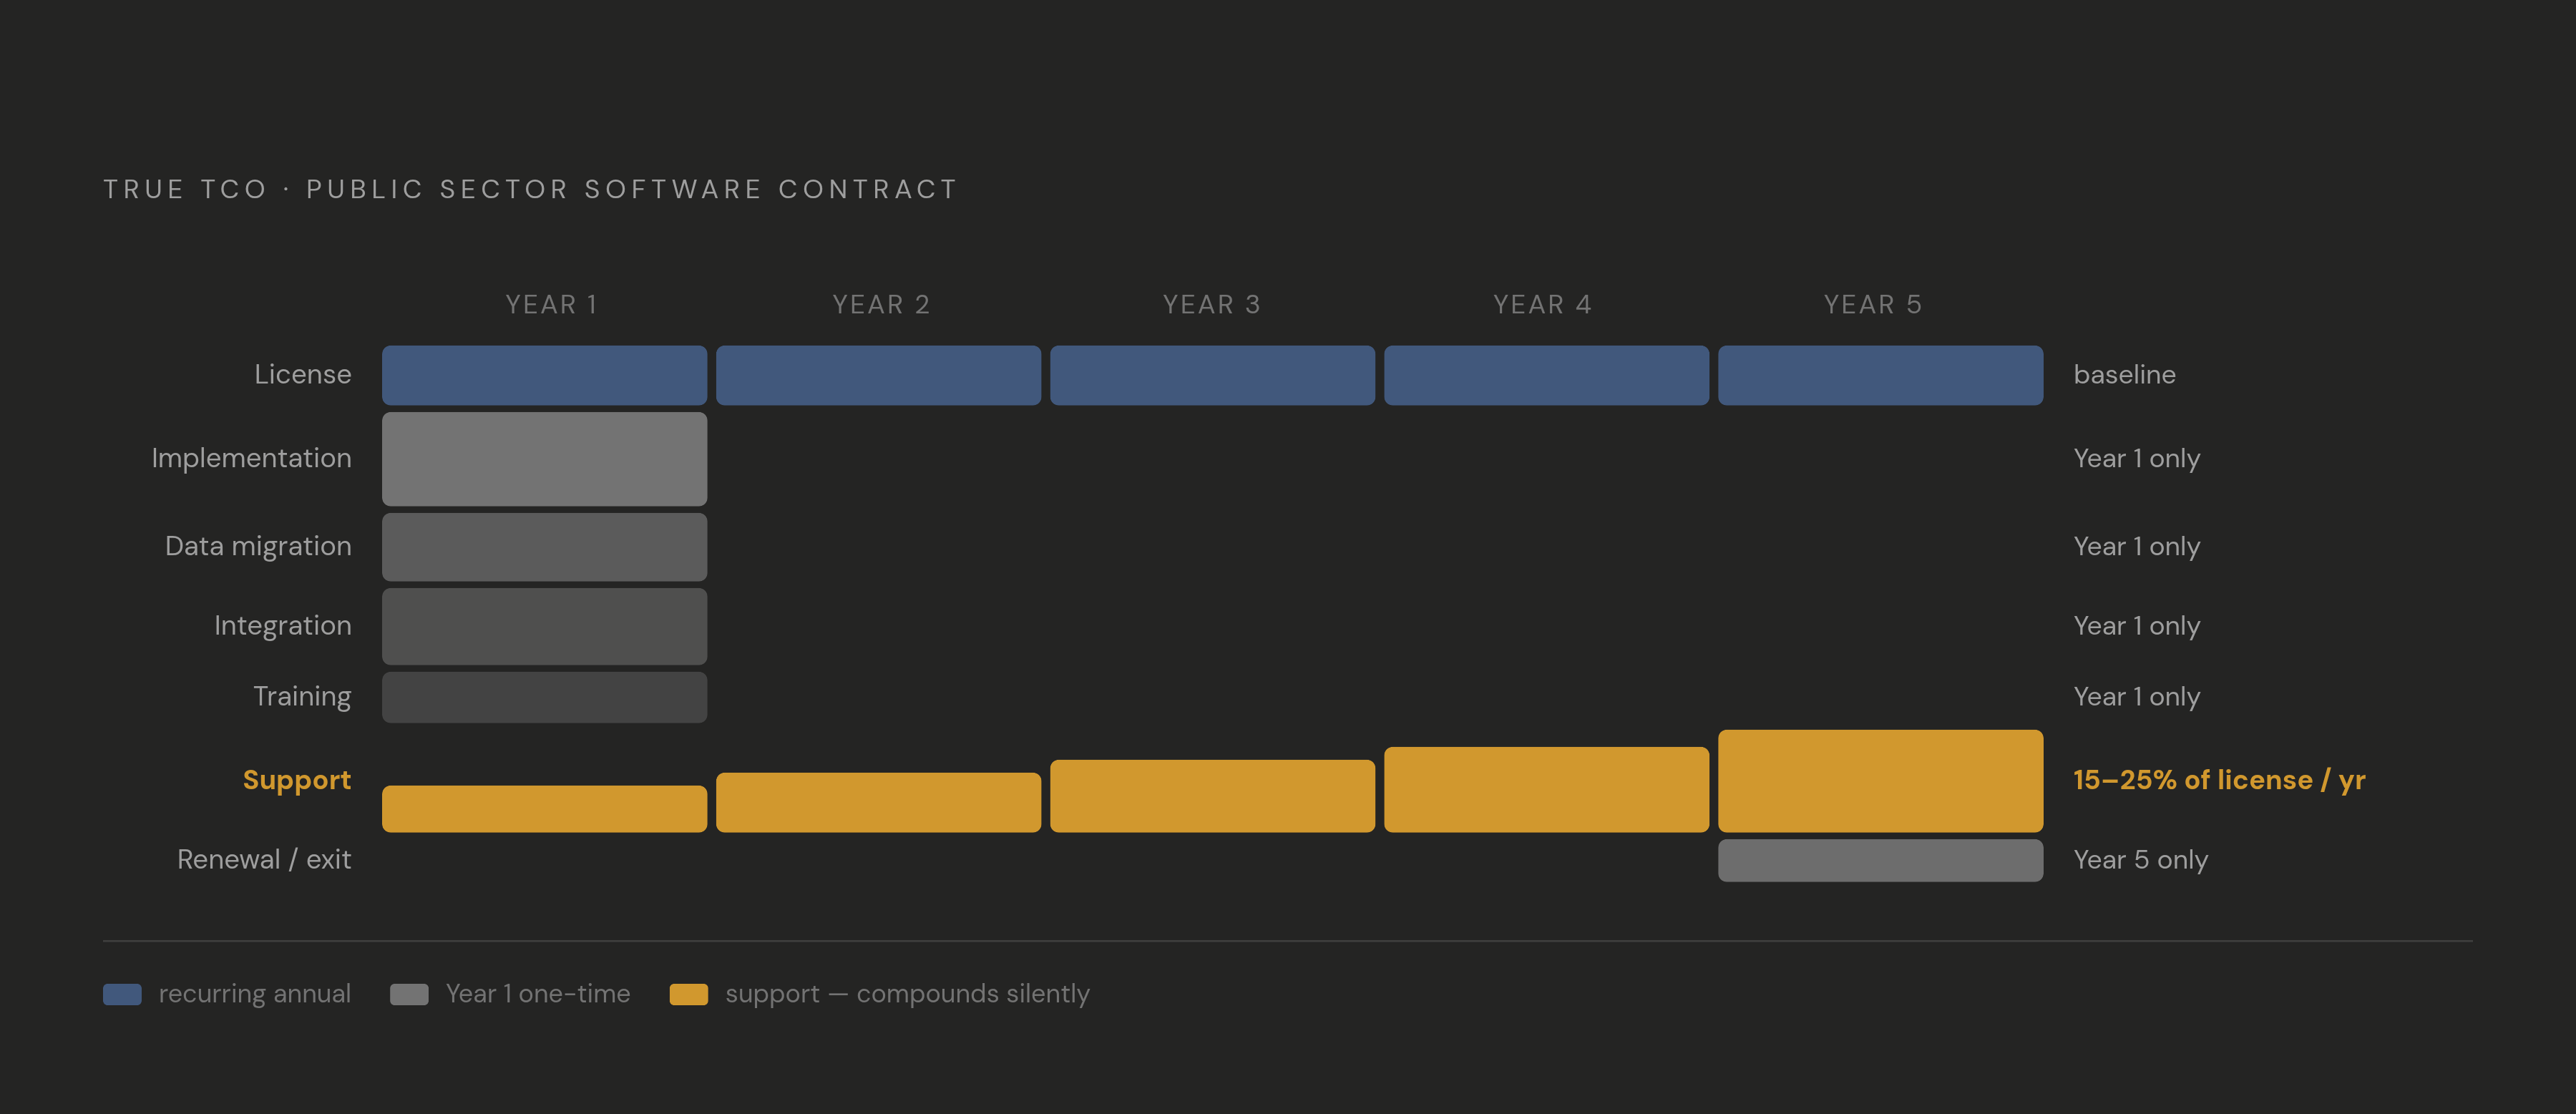
Total Cost of Ownership is not a complex framework. The Chartered Institute of Procurement and Supply organizes it into four categories: procurement costs, acquisition costs, usage costs, and end-of-life costs. Every one of those appears in a software contract, just under different names, which is a significant part of why they are so easy to undercount.
For a software deal, the cost map runs roughly like this: license fees, then implementation services, then data migration, then integration with existing systems, then training, then ongoing support contracts, then renewal repricing, then exit and transition costs when the contract eventually ends. Each of those line items is real. Most of them are larger than the license fee they follow.
Support contracts alone frequently add 15 to 25 percent of license cost per year, a figure that compounds quietly across a five-year term without anyone signing a new contract or approving a new budget line. Personnel costs are the other invisible category. In rigorous analyses, staff costs represent the largest single share of TCO: time diverted during implementation, retraining cycles after upgrades, ongoing system administration. These costs sit entirely inside the agency's operating budget, not inside the vendor's proposal, which is precisely why they never appear in the comparison spreadsheet that drives vendor selection.
Year 1 absorbs a disproportionate share of total lifecycle cost, with implementation, migration, and training all arriving simultaneously. The budget most agencies present to leadership at contract signing covers only a fraction of what Year 1 actually demands. The purpose of a rigorous TCO analysis is to make those invisible costs visible before the signature, not in the postmortem.
How Implementation and Integration Costs Overtake the Original Contract Value
Implementation costs alone can run as high as a full year of processing fees. Vendors have little structural incentive to foreground that ratio during the sales cycle, because the sales cycle is organized around winning the competitive bid. Optimizing the agency's long-term financial outcome is a different objective entirely, and conflating the two is a mistake agencies make repeatedly.
Public sector environments amplify implementation cost in ways that are predictable but routinely underestimated anyway. Fragmented multi-vendor stacks, legacy data formats, compliance requirements: all of them extend scope. Euna's 2025 State of Public Payments and Reconciliation Report found that 66 percent of finance professionals spend more than ten hours per month reconciling across systems. That is a cost observation, not a productivity one, and specifically it is the cost of integration gaps established, or left unaddressed, at procurement. Half of public agencies use three or more vendors to support payment processing. Each of those vendor boundaries is a potential integration cost, and the agency carries it, not the vendor.
Customization compounds the problem considerably. Forrester Research has found that customized solutions can increase TCO by 200 to 300 percent compared to off-the-shelf SaaS over five years, driven by integration complexity and ongoing maintenance burden. Technical integration challenges with legacy systems have amplified overruns by 200 to 500 percent in documented cases. Scope creep, change orders exploiting contract ambiguities, governance lapses that nobody caught because nobody was explicitly assigned to catch them: these are not accidents. They are the predictable consequences of underspecified requirements at the procurement stage. When the contract fails to define scope precisely, scope gets defined later by whoever holds the leverage. After signature, that is the vendor.
Why Public Sector IT Projects Overrun More Often and More Severely Than Private Sector Ones
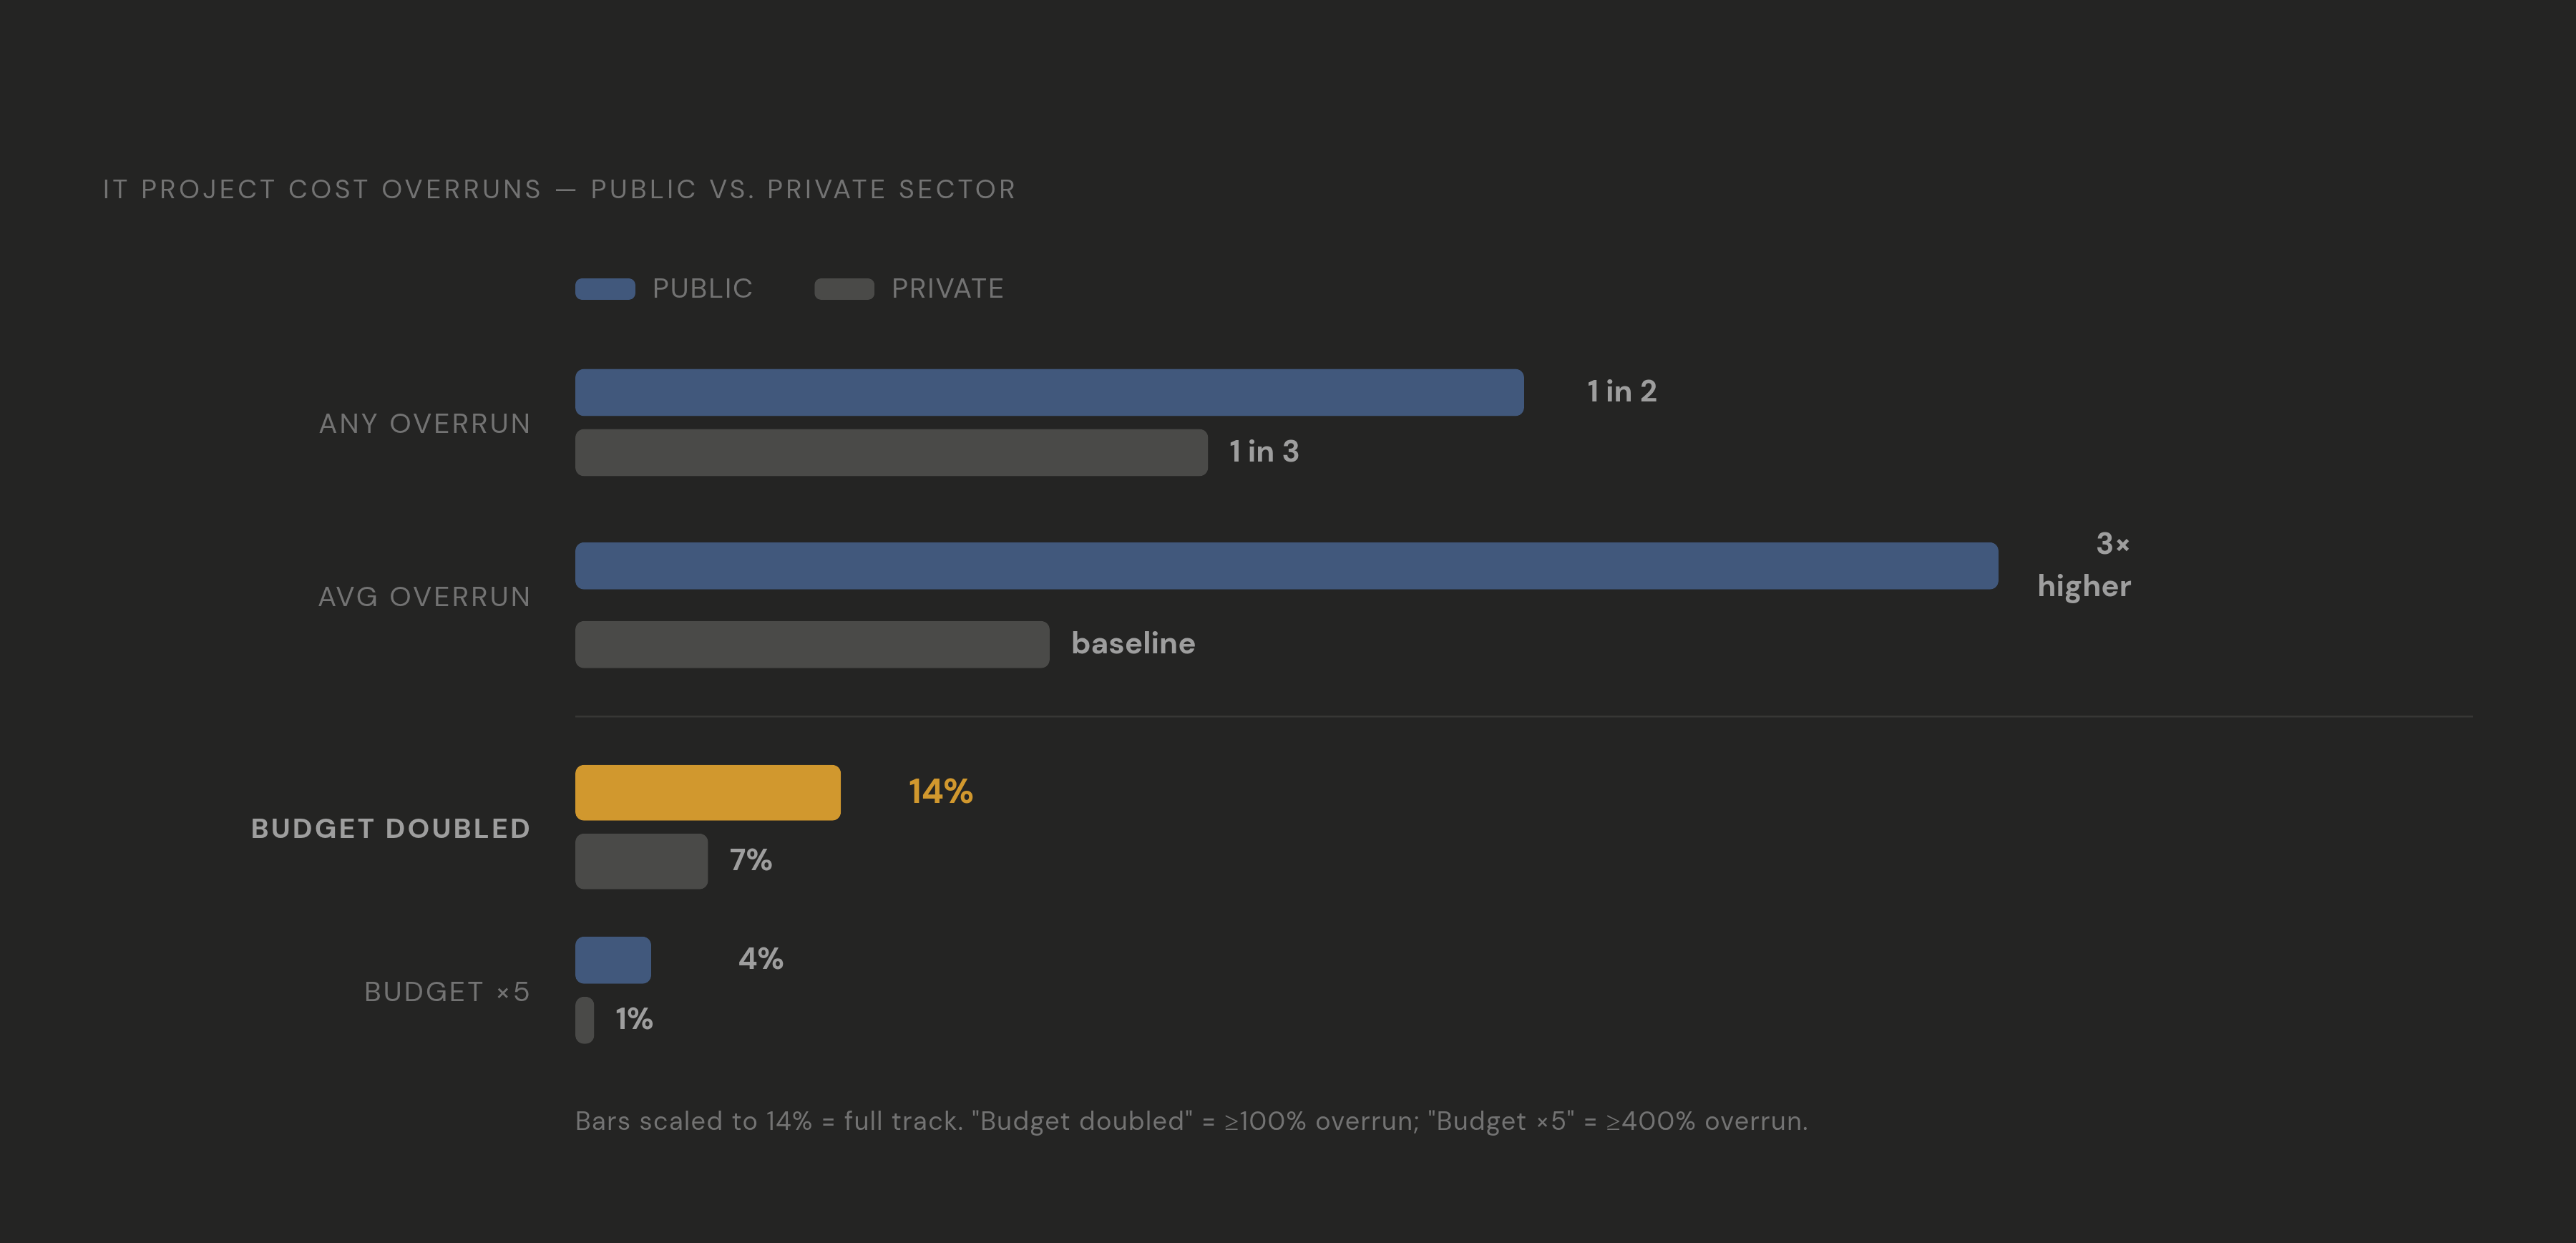
The private sector has its own procurement disasters. But the comparative outcome data is not close. Cost overruns occur in nearly one in two public-sector IT projects, versus about one in three in the private sector. The average IT project cost overrun runs nearly three times higher for public-sector organizations. Fourteen percent of public-sector projects exceeded their budget by at least 100 percent; in the private sector, that figure was 7 percent. Four percent of public projects exceeded budget by 400 percent or more, compared to 1 percent in the private sector. These are not marginal differences.
Schedule drag compounds cost in ways that multiply the underlying problem. Public-sector IT projects take an average of 3.9 years to complete, versus 2.4 years in the private sector, and more than 80 percent of public-sector IT projects overran their schedules. Extended timelines mean extended consulting engagements, extended personnel diversions, and extended periods of operating two systems simultaneously, which is both expensive and demoralizing in ways that do not show up in a budget line but absolutely show up in an organization.
The NHS National Programme for IT is the cautionary case most frequently cited, for good reason. Originally estimated at £6.4 billion, it was abandoned after approximately £10 billion had been spent, and it was described at the time as one of the worst contracting failures in public sector history.
What distinguishes public sector risk structurally is not incompetence. The problem is the combination of multi-year funding cycles, political procurement constraints, and the practical impossibility of canceling a failing project once constituent services depend on it. Once a benefits payment system or a tax collection platform is live, even a failing one, the cost of abandonment is political, not just financial. That asymmetry distorts every decision downstream, in ways that procurement reform alone cannot fully address.
Vendor Lock-In as a Compounding Cost That Arrives After the Contract Is Signed
Lock-in is not a hypothetical risk. A European Commission survey found that at least 40 percent of public procurers perceived some degree of vendor lock-in, typically attributable to lack of system interoperability or data portability. That is a widespread, documented experience.
The practical mechanics are simple: every change, every new workflow, every integration, every feature request, has exactly one supplier, at that supplier's price and on that supplier's timeline. Competitive leverage disappears at signature. What replaces it is a relationship governed entirely by switching costs.
The European Commission estimated that adopting open standards saves the EU's public sector over €1 billion annually. A parallel analysis put the cost of brand-specific procurement to EU governments at approximately €1.1 billion per year in higher prices. In the U.S. federal context, Microsoft and Oracle received at least 25 to 30 percent of government software sales over the last decade through less than fully competitive procurement processes, per a report commissioned by NetChoice. A 5 percent reduction in that spend through increased competition saves taxpayers up to $750 million annually.
The UK's Crown Commercial Service SPA24 agreement illustrates the concentration dynamic at scale: approximately £9 billion committed over five years on Microsoft products, with around £1.9 billion already spent by the end of FY2024/25. Microsoft products represent genuine value in many contexts. But a contract of that concentration requires explicit modeling of what exit or renegotiation would actually cost. Skipping that step is precisely what converts a vendor relationship into a vendor dependency.
Lock-in does not always result from a bad decision at signing. It frequently results from a contract that was otherwise reasonable but never priced exit costs or required data portability. The cost was always there. It was never acknowledged.
Legacy Systems as the Long-Term Consequence of TCO Decisions Made a Decade Ago
The GAO identified 11 legacy federal IT systems most in need of modernization as of July 2025. Eight run on outdated programming languages. Four have unsupported hardware or software. Seven carry known cybersecurity vulnerabilities. Two Treasury systems flagged in that assessment run on COBOL and Assembly Language, and the support pool for those languages is shrinking at a measurable, documented rate: the average COBOL programmer is 55 years old, with 10 percent of that workforce retiring annually. That is not a future problem. It is a compounding present one.
Nearly half of public sector C-suite executives, per Deloitte's 2025 research, identify legacy systems as a primary barrier to change. That is the predictable endpoint of a TCO decision made years ago that prioritized Year 1 budget optics over lifecycle cost modeling.
Here is what those conversations actually look like. The pressure to get something signed before the fiscal year closes. The optimism about integration timelines that everyone in the room privately doubts. A quiet, unspoken agreement not to surface the ten-year cost picture because the number would make leadership uncomfortable and the deal would stall and somebody's performance review would suffer for it. Nobody says that out loud. Nobody has to. The pattern recurs so reliably across agencies and administrations and vendor relationships that it has stopped feeling like a failure of individual judgment and started feeling like a feature of the system itself. The legacy systems that result are not mysterious. They are just what that conversation produces, repeated at scale.
The modernization ROI case is genuinely compelling. Kyndryl's 2025 State of Mainframe Modernization survey reports ROI ranging from 288 percent for modernizing applications on the mainframe to 362 percent for moving workloads off it entirely. But that ROI requires upfront investment, and upfront investment requires a TCO case strong enough to survive political scrutiny. Agencies that cannot make that case are, almost universally, agencies that did not build a rigorous TCO analysis the first time around.
How Procurement Rules and Political Incentives Systematically Undermine Lifecycle Cost Thinking
Lowest-bid procurement rules do not produce incompetent procurement officers. They produce rational ones. If the selection criterion is headline price, the winning behavior is to present the lowest headline price. Vendors optimize for the criterion. Agencies evaluate against it. Lifecycle cost lands outside that conversation entirely, not because anyone forgot about it, but because the structure rewards ignoring it.
Multi-year funding cycles compound this dynamic. The agency that signs the contract is often not the agency that absorbs the overrun. Budget cycles, leadership turnover, and political transitions diffuse accountability across time in ways that make it genuinely difficult to connect a procurement decision to its downstream cost. That diffusion is not an accident of bureaucracy. It is a structural feature that vendors and procurement timelines have both adapted to, comfortably.
Austerity pressure sharpens the tension further. Utah CIO Alan Fuller has noted publicly that any new spending needs to be offset elsewhere, a constraint that makes it politically difficult to invest in modernization even when the long-term math is unambiguous. The five-year savings case requires a five-year frame, and most budget conversations do not operate in that frame. They operate in the frame of this fiscal year, this appropriation cycle, this leadership tenure.
The EU Public Procurement Directives of 2014 represent one substantive legislative attempt to reorient that frame, establishing "most economically advantageous tender" as the default selection criterion and explicitly promoting life-cycle costing, including costs associated with lack of interoperability. The forthcoming revision of those directives is expected to address vendor lock-in more directly. That the problem requires legislative intervention to be taken seriously at the procurement stage says something unflattering about how resistant the existing incentive structure is to practitioner-level reform.
What a Rigorous TCO Analysis Covers Before an Agency Signs Anything
A rigorous TCO analysis is not a longer spreadsheet. It is a different frame, applied before the contract is signed, when leverage still exists.
Model the full five-year cost stack before presenting any number to leadership. Implementation and migration absorb a disproportionate share of five-year TCO in Year 1, which means the Year 1 budget is not a proxy for the deal's true cost. It is the most visible slice of a much larger commitment.
Cap maintenance fees contractually. Negotiating fixed-price contracts that cap maintenance at 15 percent of initial costs limits one of the most common post-signature cost escalators. This is a negotiating point that must be made before the contract is signed. It will be unavailable after.
Require open APIs and data portability clauses as a procurement condition. The European Commission's life-cycle costing framework treats lack of interoperability as a cost to be priced in. U.S. agencies can apply the same logic contractually, without waiting for a legislative mandate.
Allocate a customization contingency in the base budget: 15 to 25 percent of the base contract value, with phased audits and explicit change-order governance built into the contract structure. Scope creep is predictable. Budget for it before it becomes a change order issued at the vendor's discretion.
Build a personnel cost model. Staff time diverted during implementation, productivity loss during transition, retraining cycles: these are costs that sit inside the agency's operating budget, not inside the vendor's proposal. They are frequently the largest single cost category in a rigorous TCO analysis, and they are the category most often omitted from the comparison that drives vendor selection.
Price exit explicitly. Data migration, transition services, and retraining on a replacement system are costs of the current contract, even if they are not payable for five years. A procurement that does not model exit has not modeled its full obligation.
Gartner's research finds that organizations focusing only on sticker price see total costs rise by 15 to 20 percent once invisible expenses materialize. The TCO analysis is the document that makes those expenses visible before the contract is signed. Everything else is just a very expensive way to learn the same lesson.