Measuring Government Digital Transformation Progress
Three frameworks now measure government digital transformation, each revealing different gaps.
Three frameworks now anchor how the international development and public administration community measures government digital transformation: the UN E-Government Development Index, the OECD Digital Government Index, and the World Bank GovTech Maturity Index. Understanding what each one actually measures, and what it deliberately leaves out, is not a preliminary step for practitioners. It is the work itself.
Governments are under real pressure here. Public expectations for seamless digital services have outpaced the institutional machinery that was built in a different era, and digital technology has shifted from a convenience layer into core public infrastructure. That shift demands accountability. But transformation spans infrastructure, services delivery, data governance, citizen engagement, and institutional capacity simultaneously. No single metric can hold all of that. The three frameworks exist because the problem is genuinely multidimensional, and using only one of them produces a partial, sometimes misleading picture — like trying to read a map with only one eye: technically possible, but you'll miss the depth.
How the UN E-Government Development Index Is Constructed and What It Measures
The EGDI covers all 193 UN Member States. That geographic breadth is its defining feature, and it is the widest scope of any framework discussed here. The 2024 edition was the 13th survey cycle, and the methodology has evolved with each iteration, most recently expanding the Online Services Index from 180 to 183 indicators between 2022 and 2024.
The index rests on three equally weighted pillars. The Online Services Index assesses what governments actually deliver digitally. The Telecommunications Infrastructure Index measures the connectivity foundations that make delivery possible. The Human Capital Index captures education and workforce capacity. Each pillar carries a third of the final score.
The OSI is itself a composite, built from five subindices covering institutional framework, services provision, content provision, technology, and e-participation. That last one is worth pausing on. The e-participation subindex tracks whether governments use digital channels to involve citizens in policy formation, not just to push services out to them. It is a meaningful distinction that most people overlook.
There is a structural limitation built into the design, and it matters for anyone applying this data to federal systems. EGDI scores at the national level. In large, decentralized countries, state or sub-national governments may differ dramatically in digital maturity. Those differences collapse into a single national score. You lose the variance entirely — the EGDI is like averaging the temperature of every city in a country and calling it the weather.
What the EGDI is genuinely best for: cross-country comparison over time, tracking which nations move between maturity tiers, and identifying infrastructure or services gaps at a macro level. Use it for the wide view. Do not ask it to tell you what is happening inside a government.
What the 2024 EGDI Data Shows About the State of Global Digital Government
The headline trend is unambiguous. The global average EGDI rose from a moderate baseline in 2022 to a higher level in 2024, continuing a sustained upward trajectory that has now persisted across multiple survey cycles.
The tier distribution in 2024 tells a more consequential story. Seventy-six countries landed in the Very High tier, scoring between 0.75 and 1.00. Sixty-two fell in the High tier, 44 in the Middle, and 11 in the Low tier. For the first time, the Very High tier is the largest single cohort, representing 39% of all evaluated nations. That is a structural shift, not noise.
The population-level figures are even more striking. The share of the global population living under low digital government development fell from 45.0% in 2022 to 22.4% in 2024. The count of countries in the middle and low tiers dropped from 106 in 2014 to 55 in 2024. Progress at scale is real.
The regional picture is uneven in the way anyone familiar with development economics would expect. Europe leads with an average of 0.8493. Asia and the Americas sit in the middle range. Oceania and Africa trail. But the rate of improvement reverses that hierarchy: Asia posted the sharpest gain at 7.7%, followed by Africa at 4.8%. Europe improved at 2.3%. The gap is narrowing from below, which is the more important directional signal.
The primary driver of score gains globally is the Telecommunications Infrastructure Index, which grew 19.9% over two years. Infrastructure investment, not services sophistication, is currently moving the needle most. That is an important policy implication: many governments are still in the foundation-building phase. You could say they're still laying the pipes before they can turn on the taps.
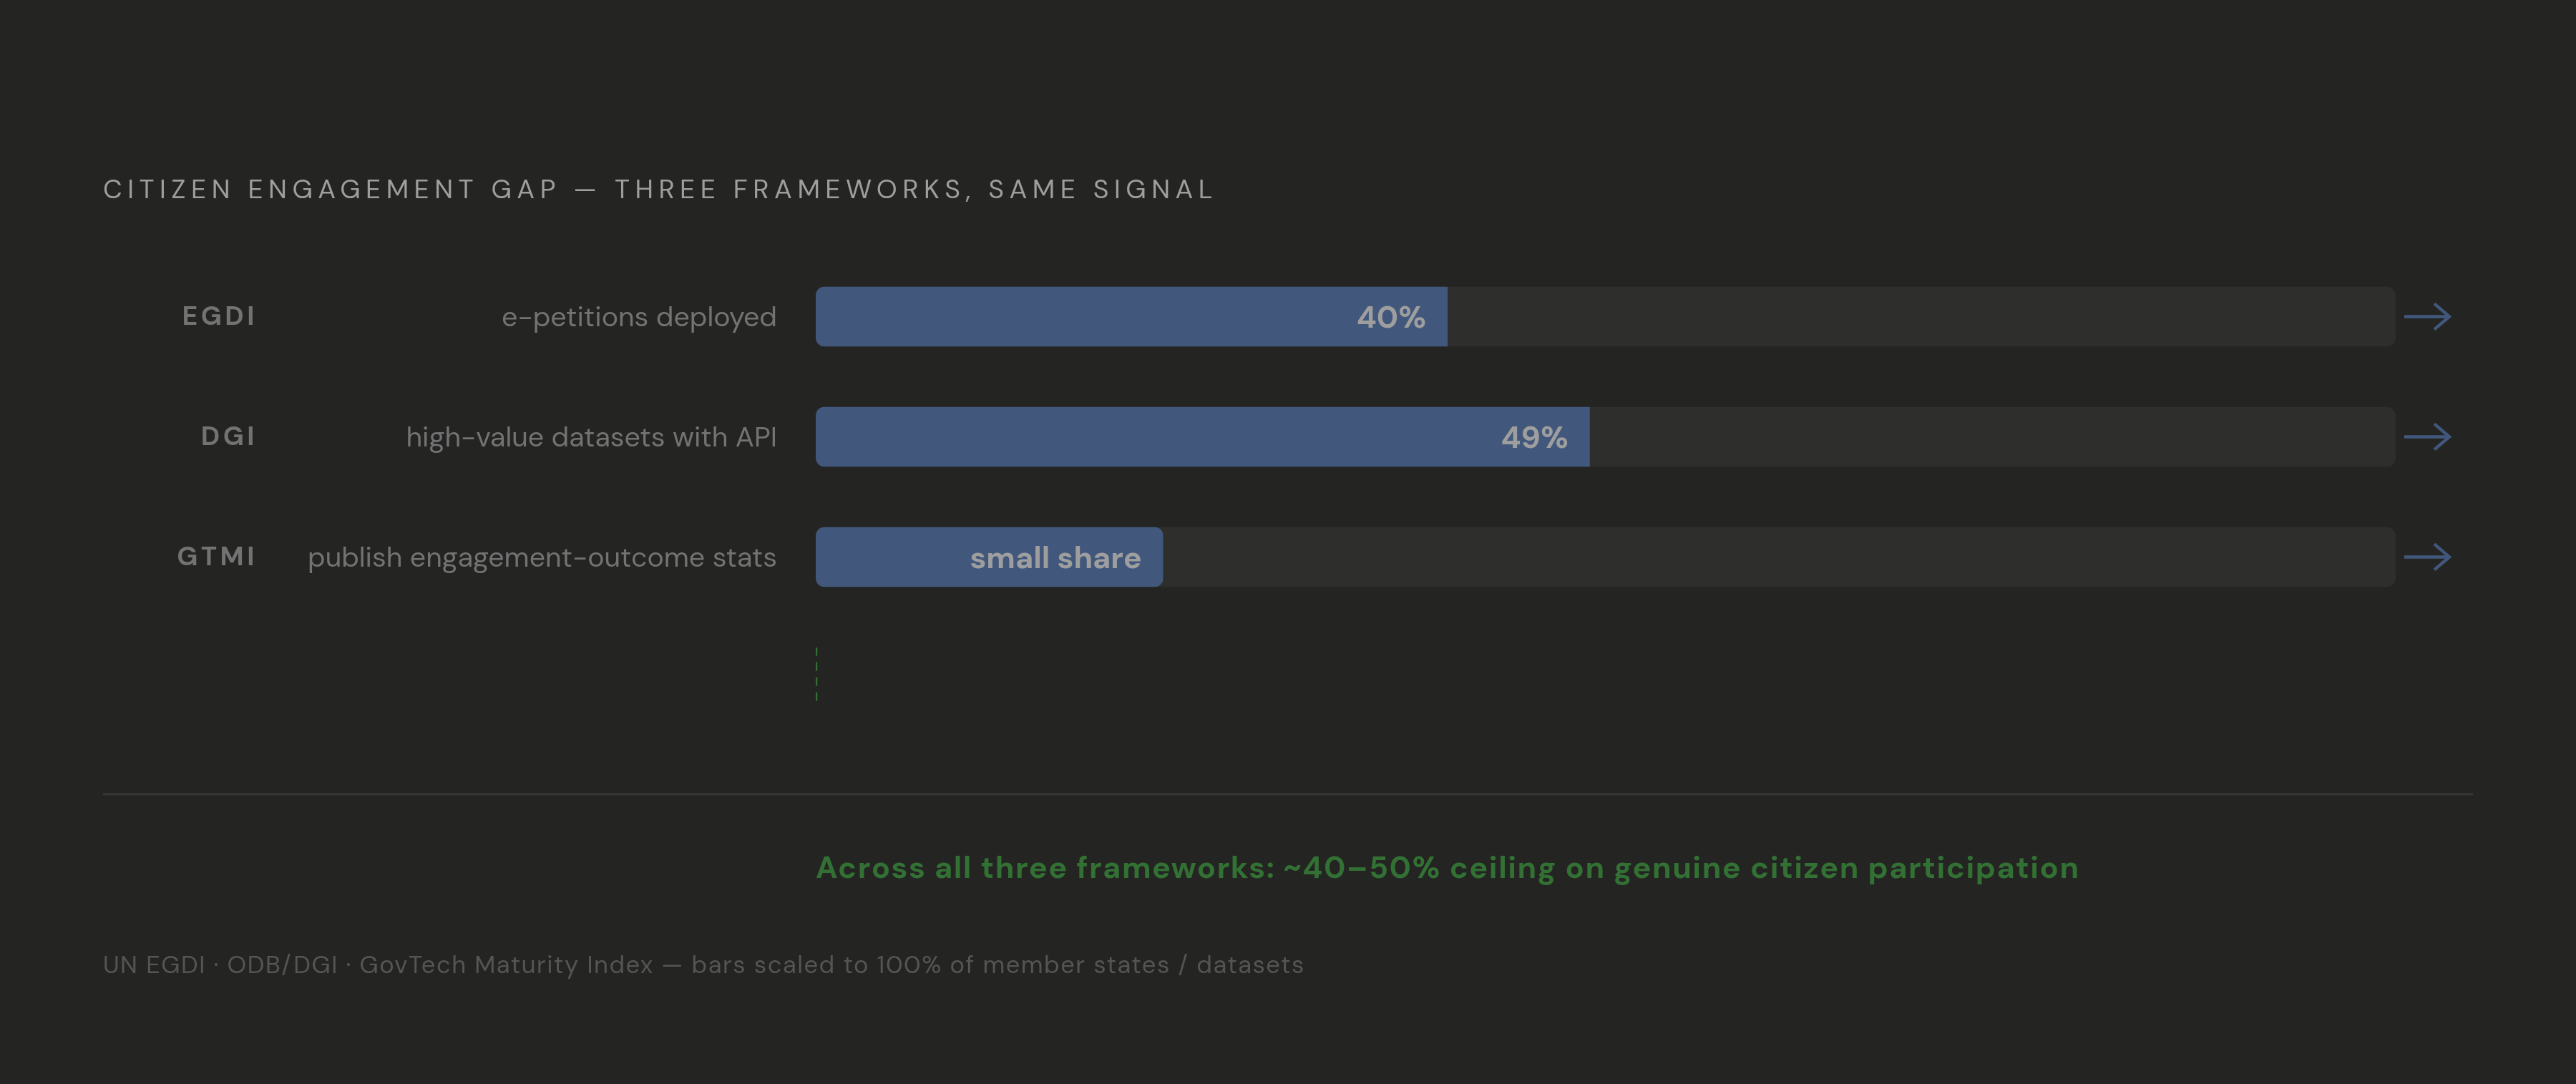
The e-participation findings reveal a persistent engagement gap. Roughly half of Member States have a dedicated e-participation portal. About 55% publish consultation calendars. Only around 40% deploy e-petitions or comparable mechanisms. Services are running well ahead of participatory governance.
The core unresolved question is this: EGDI measures inputs and presence. Does the portal exist? Does the country have broadband penetration above a threshold? It does not measure whether people use the portal, whether it works reliably, or whether the service delivers a meaningful outcome. That limitation is not a flaw in the index. It is a design constraint you have to account for.
How the OECD Digital Government Index Measures the Policy and Institutional Side of Transformation
The DGI covers 42 countries, primarily OECD members plus accession candidates. It is a narrower sample than the EGDI by design, because it goes considerably deeper into governance architecture.
The core purpose of the DGI is to benchmark whether governments have built the policy foundations for coherent, human-centred digital transformation. Not whether digital services exist, but whether the institutional conditions exist to sustain transformation over time.
Six dimensions are assessed. Digital by design asks whether digital tools are embedded into how services are conceived from the start, rather than retrofitted onto legacy processes. Data-driven examines governance and enablers for data access, sharing, and reuse inside government. Government as a platform evaluates whether common components, such as digital identity, shared software, and standard APIs, are deployed to drive consistent transformation across agencies. Open by default goes beyond publishing datasets to include how governments use technology for broader engagement. User-driven assesses whether services are actually shaped by citizen needs and feedback. Proactiveness asks the most demanding question: whether government anticipates needs and delivers services before citizens have to request them.
The index scores from 0 to 1. A companion instrument, the OURdata Index, specifically measures open government data policy, covering availability, accessibility, and reusability of public datasets.
The conceptual distinction from EGDI is sharp and important. The DGI is explicitly policy-facing. It asks what institutional choices and governance frameworks a government has made. It does not ask what infrastructure has been built or how many services are listed on a government portal. Those are different questions, and conflating them produces analytical errors that derail reform programs before they begin. To put it plainly: a government can build a beautiful front door while the hallways inside are a maze with no exits.
That geographic breadth is its defining feature, and it is the widest scope of any framework discussed here.
What the 2025 OECD DGI Results Reveal About Where Policy Progress Is Concentrated and Where It Stalls
The OECD-wide DGI average rose from 0.61 in 2023 to 0.70 in 2025, a 14% increase. Broad momentum is real: all but seven OECD countries improved their scores. Korea led the rankings at 0.95, followed by Australia at 0.88 and Portugal at 0.86. Nearly all OECD governments scored above 0.50, with 17 surpassing the OECD average.
The open data gap is where the results become genuinely instructive. The OURdata Index rose only from 0.48 to 0.53, a much more modest gain relative to the DGI improvement. Fifty-seven percent of high-value datasets are available as open data; 67% are accessible via central portals. But only 49% offer API access. The practical implication is clear: governments are publishing data, but they have not built the technical infrastructure for others to programmatically consume and build on it. Publishing a file and providing an API are not equivalent acts of openness — one is leaving a book on a shelf; the other is handing someone a key to the library.
The accession country gap is significant. Their DGI average sits 0.20 points below the OECD average, and their OURdata average is 0.07 lower. These are countries with genuine digital ambitions but weaker policy foundations, and the gap compounds over time if structural investment does not follow.
One limitation of the DGI deserves explicit acknowledgment. It captures policy design and institutional intent, not whether citizens experience better outcomes. A government can score well by adopting a coherent strategy without having executed it effectively. The index rewards the architecture of governance, not its lived performance. That is not a criticism; it is a precision point for how you interpret the scores.
How the World Bank GovTech Maturity Index Approaches Transformation Differently from EGDI and DGI
The GTMI covers 197 economies, the broadest sample of the three frameworks, with hundreds of officials from 158 economies contributing directly to the data collection. The methodology is grounded in primary data from practitioners, which shapes what it can and cannot see.
The explicit design choice here is the most distinctive feature of the GTMI: it is not a ranking. It is a reference tool to help governments design digital transformation initiatives. It is not evaluating competitive performance. That framing matters because it changes how the data gets used in practice. Reform teams use the GTMI to diagnose gaps, not to compare scores with neighbors.
Four domains are covered by 48 indicators. Core government systems and shared digital infrastructure address the back office. Online public service delivery addresses the front office. Digital citizen engagement is a third domain. GovTech enablers, encompassing strategy, institutions, laws, digital skills, and innovation policy, form the fourth.
The 2025 update added several sub-indicators that reflect where the field is genuinely moving: platform utilization and performance metrics (not just whether a platform was built, but whether it is being used), ethical AI use in government, green technology policy for GovTech, and digital identity in public service delivery. These additions signal the framework's intent to stay proximate to practice rather than to codify prior cycles.
The GTMI's most distinctive contribution relative to EGDI and DGI is its back-office focus. Payroll systems, human resources management, interoperability frameworks, and enterprise architecture are invisible to citizen-facing assessments. They are also the systems that determine whether front-office services can ever work reliably at scale. The GTMI is the only framework of the three that makes this internal infrastructure visible — it looks past the storefront and examines whether the supply chain behind it is actually running.
What the 2025 GTMI Data Reveals About Back-Office Fragmentation and the Widening Digital Divide
At the surface level, progress is evident. The Group A economies, those demonstrating the most extensive maturity, now represent 41% of evaluated economies, up from 35% in 2022. More governments are reaching high maturity thresholds across the four domains.
But the divide is widening, not narrowing. The gap in average GTMI scores between the most mature and least mature groups grew measurably from 2022 to 2025. The leaders are pulling further ahead. That divergence is the more structurally important finding, and it runs counter to the convergence narrative that the EGDI regional growth rates suggest.
Front-office coverage is genuinely broad. Over three-quarters of economies report core online services, including tax portals, e-filing, e-payments, and customs single windows. Fifty-nine percent now use digital identity for identification and online services, a new indicator introduced in the 2025 cycle.
The back-office picture is where the data becomes uncomfortable. Implementation of payroll systems declined in a notable share of economies since 2022. Human resources management information systems declined in a comparable share of economies over the same period. These are not aspirational systems; they are foundational. And they are moving backward in a non-trivial share of the field.
Whole-of-government institutionalization, encompassing enterprise architecture and interoperability frameworks, is present in only 46 economies, a small minority of the total. That means more than three-quarters of evaluated governments lack the internal coherence that makes sustained, coordinated transformation possible.
The citizen engagement transparency gap is striking in a different way. Only a small share of economies publish statistics on citizen engagement outcomes. Governments are building engagement channels. They are not reporting whether those channels work or whether anyone uses them.
Emerging governance areas show adoption but not maturity. A substantial minority of economies report AI ethical guidelines; a similar share report green technology policies for GovTech. These figures represent nascent governance being adopted, not established practice being executed.
The core implication of the GTMI data is this: a government can score respectably on front-office delivery metrics while running fragmented, declining back-office infrastructure underneath. That tension is real and common. The GTMI is the only framework of the three designed to surface it.
How the Three Frameworks Complement Each Other When Used Together
Each framework answers a different question. The EGDI asks where a country stands globally and whether its infrastructure and services foundations are in place. The DGI asks whether a government has built the policy architecture and institutional conditions for sustained transformation. The GTMI asks whether the internal systems are actually functional and improving.
The coverage gaps are also distinct. The EGDI misses sub-national variation in federal systems and does not distinguish policy intent from infrastructure presence. The DGI covers 42 countries and measures policy design without tracking operational outcomes. The GTMI avoids ranking, which makes cross-country comparison harder, but it uniquely captures internal government systems that citizen-facing surveys never reach.
A government can look strong on the EGDI because its infrastructure scores are high and its services presence is visible, while simultaneously scoring weakly on the DGI because its data governance is fragmented and its policy architecture is incoherent, while the GTMI shows back-office systems in decline. All three conditions can be true at the same time. The picture changes depending entirely on which lens is applied.
For practitioners assessing a specific country or designing a reform program, triangulating across all three surfaces the gaps that any single framework would obscure. The engagement gap, specifically, is a consistent finding across all three from different angles. E-participation portals exist at reasonable rates per the EGDI; open data APIs remain incomplete per the DGI; citizen engagement statistics go unpublished per the GTMI. Three frameworks, built on different methodologies and covering different dimensions, converge on the same finding: governments are further ahead at building services than at genuinely listening to citizens.
The shared blind spot across all three is equally important to name. They measure government actions and outputs. They do not measure citizen experiences or service quality from the user's perspective. A high EGDI score tells you that services exist. A high DGI score tells you that policy architecture is coherent. A strong GTMI profile tells you that back-office systems are functional. None of them tell you whether a citizen with limited digital literacy, unreliable internet access, or complex needs was actually served. That gap in the measurement discipline is real, and any practitioner drawing policy conclusions from these indexes should hold it clearly in view.
Sources
- https://desapublications.un.org/sites/default/files/publications/2024-09/(Chapter%201)%20E-Government%20Survey%202024%201392024.pdf
Provided the structural details of the EGDI's five subindices within the Online Services Index and the expansion from 180 to 183 indicators.
- https://www.un.org/en/desa/digital-transformation-accelerates-gaps-underscore-need-new-framework-advance-use
Sourced the characterization of the EGDI's upward trajectory across multiple survey cycles.
- https://www.oecd.org/en/publications/digital-government-outlook_0496b2bc-en/full-report/digital-governments-at-a-turning-point_0491aad4.html
Provided the 2025 DGI scores, the 14% overall increase, and the open data API and portal accessibility figures.
- https://www.oecd.org/en/publications/digital-government-index-and-open-useful-and-re-usable-data-index_6347ec74-en.html
Supplied the six dimensions of the OECD Digital Government Index assessed in the framework.
- https://www.worldbank.org/en/programs/govtech/gtmi
Provided background on the GTMI's design as a reference tool rather than a ranking, its four domains, and its 48 indicators.
- https://www.worldbank.org/en/programs/govtech/gtmi-2025-update
Provided the 2025 GTMI data on Group A economies, new sub-indicators including ethical AI and digital identity, and back-office system trends.